


BI Module
RDOWEB transforms raw data into meaningful information to support decision-making in your company. Data collected in the field is organized according to a standard format, enabling the analysis of large volumes of information. This allows you to identify patterns, trends, and anomalies, calculate productivity, and determine progress curves, among other things.
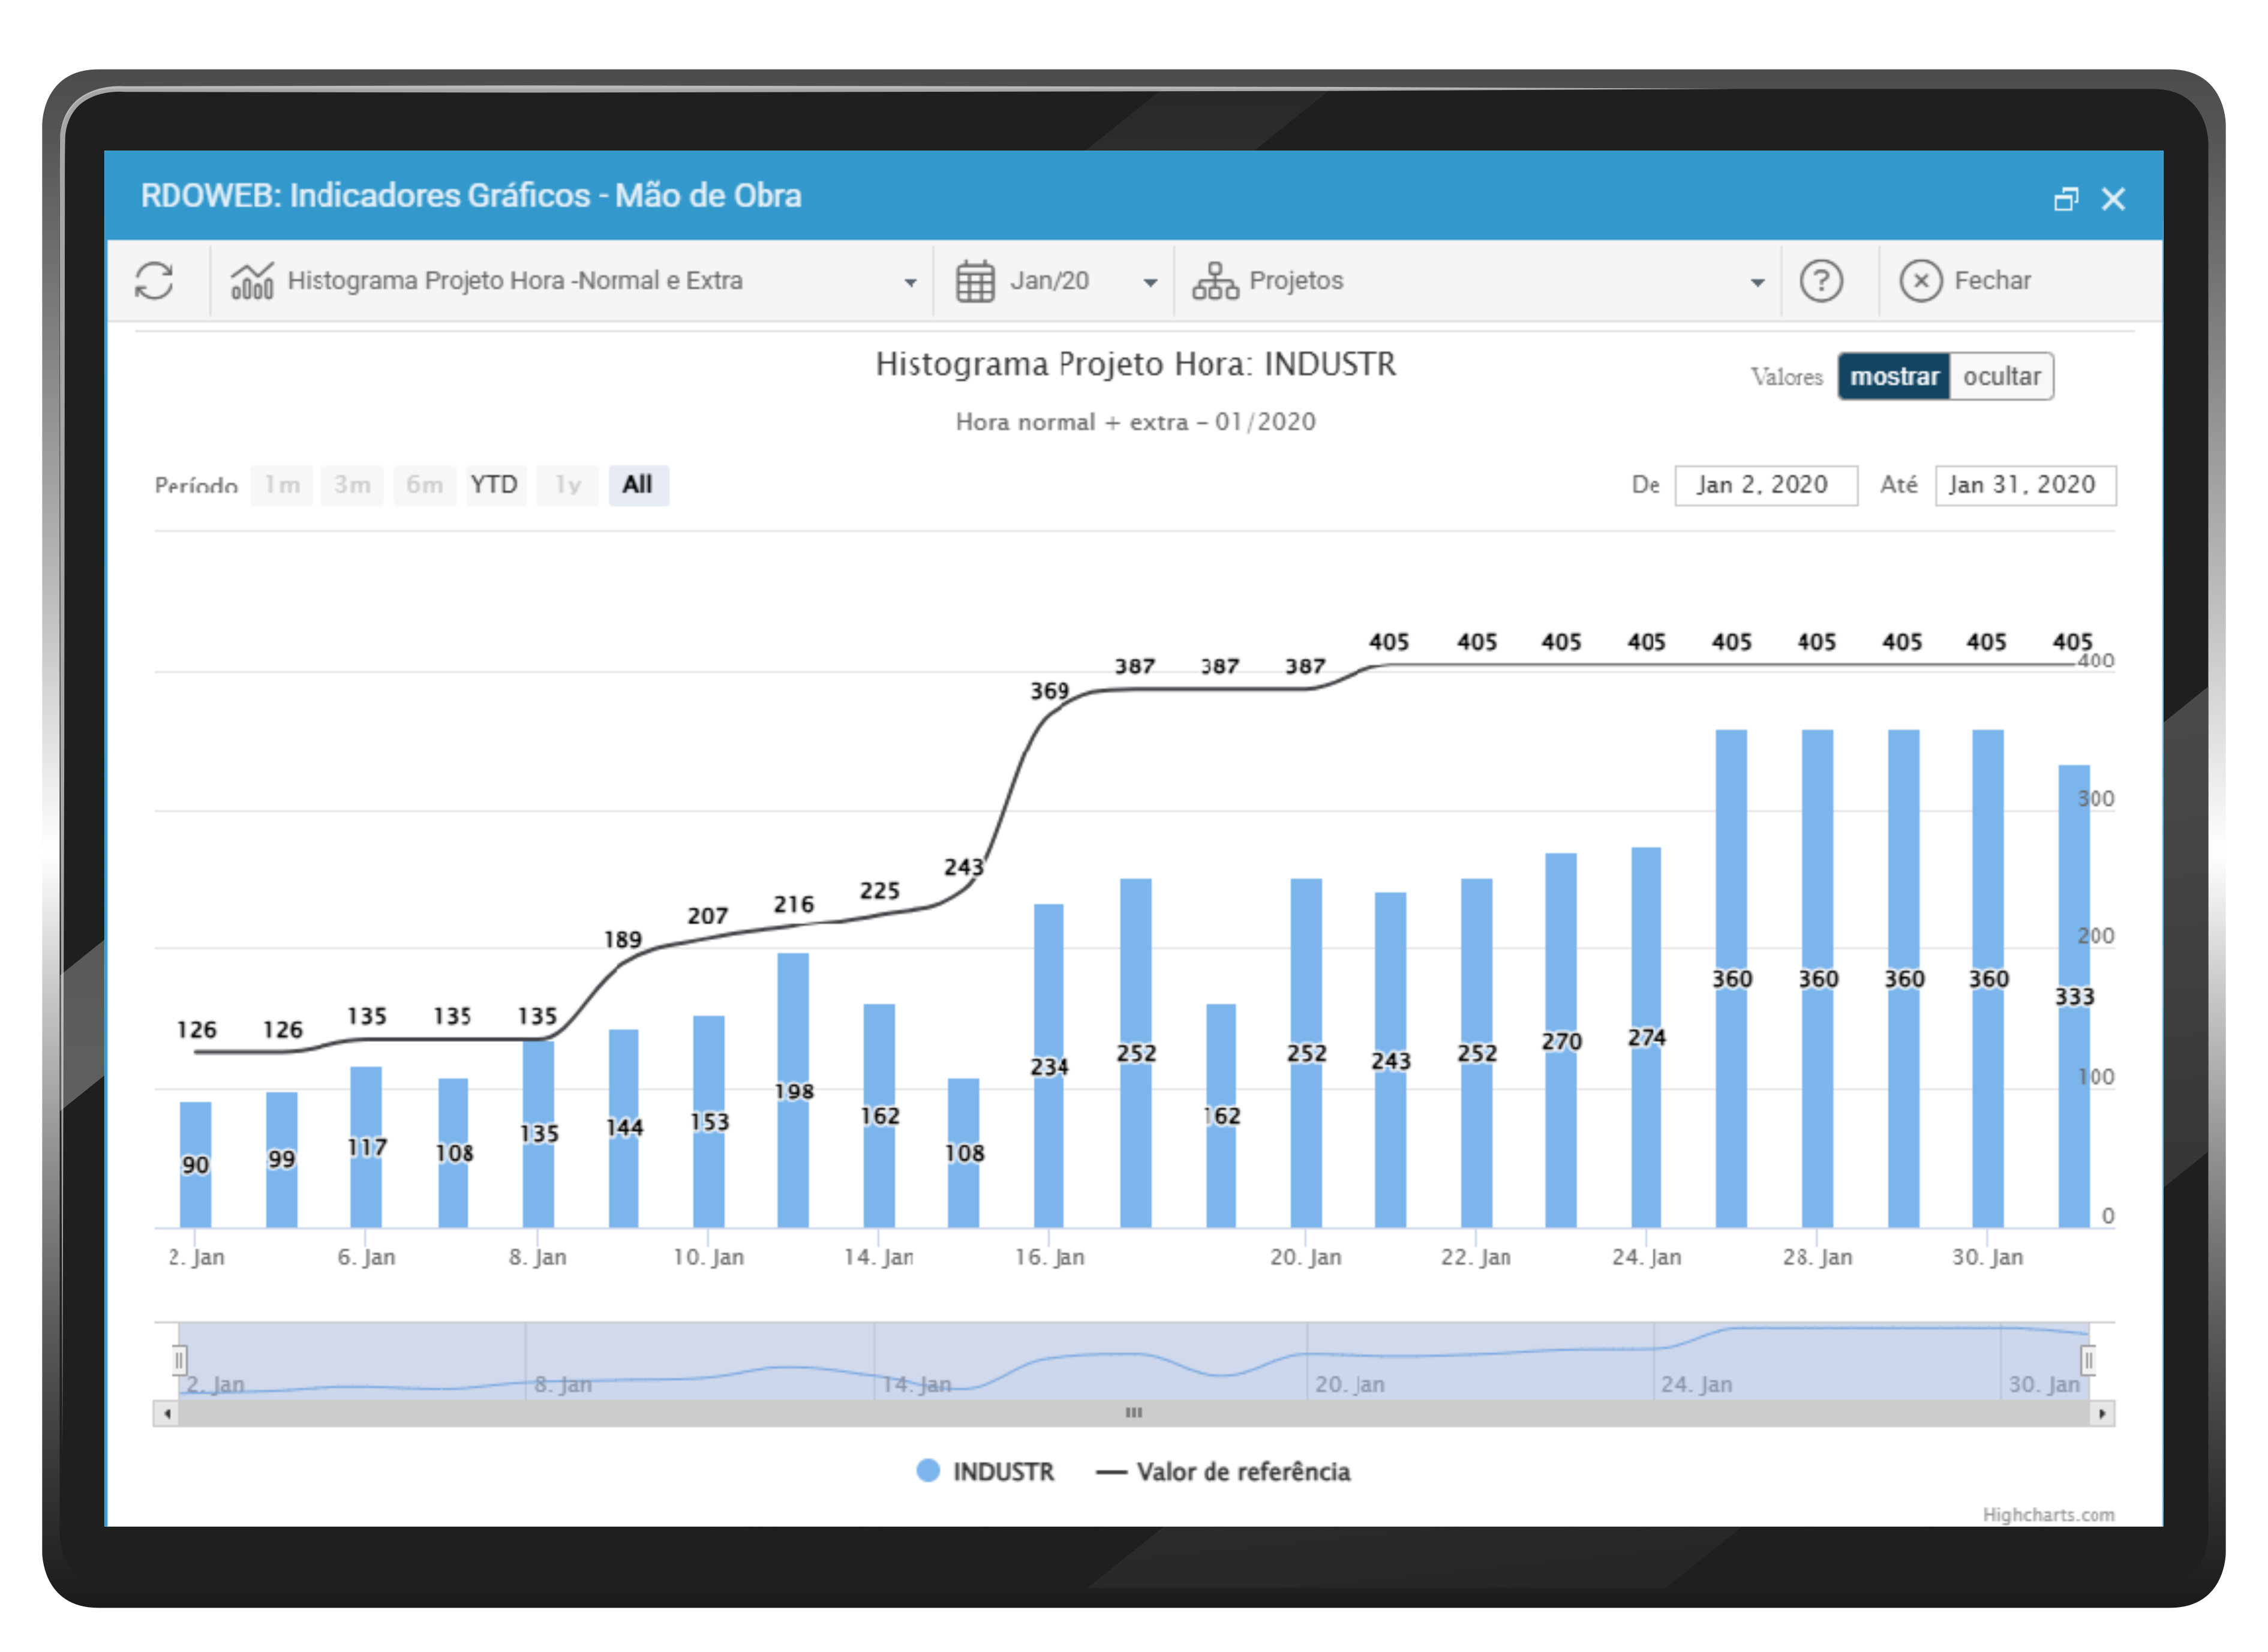
Productivity & Workforce
Operational Performance Management, integrates data from the field with engineering planning.
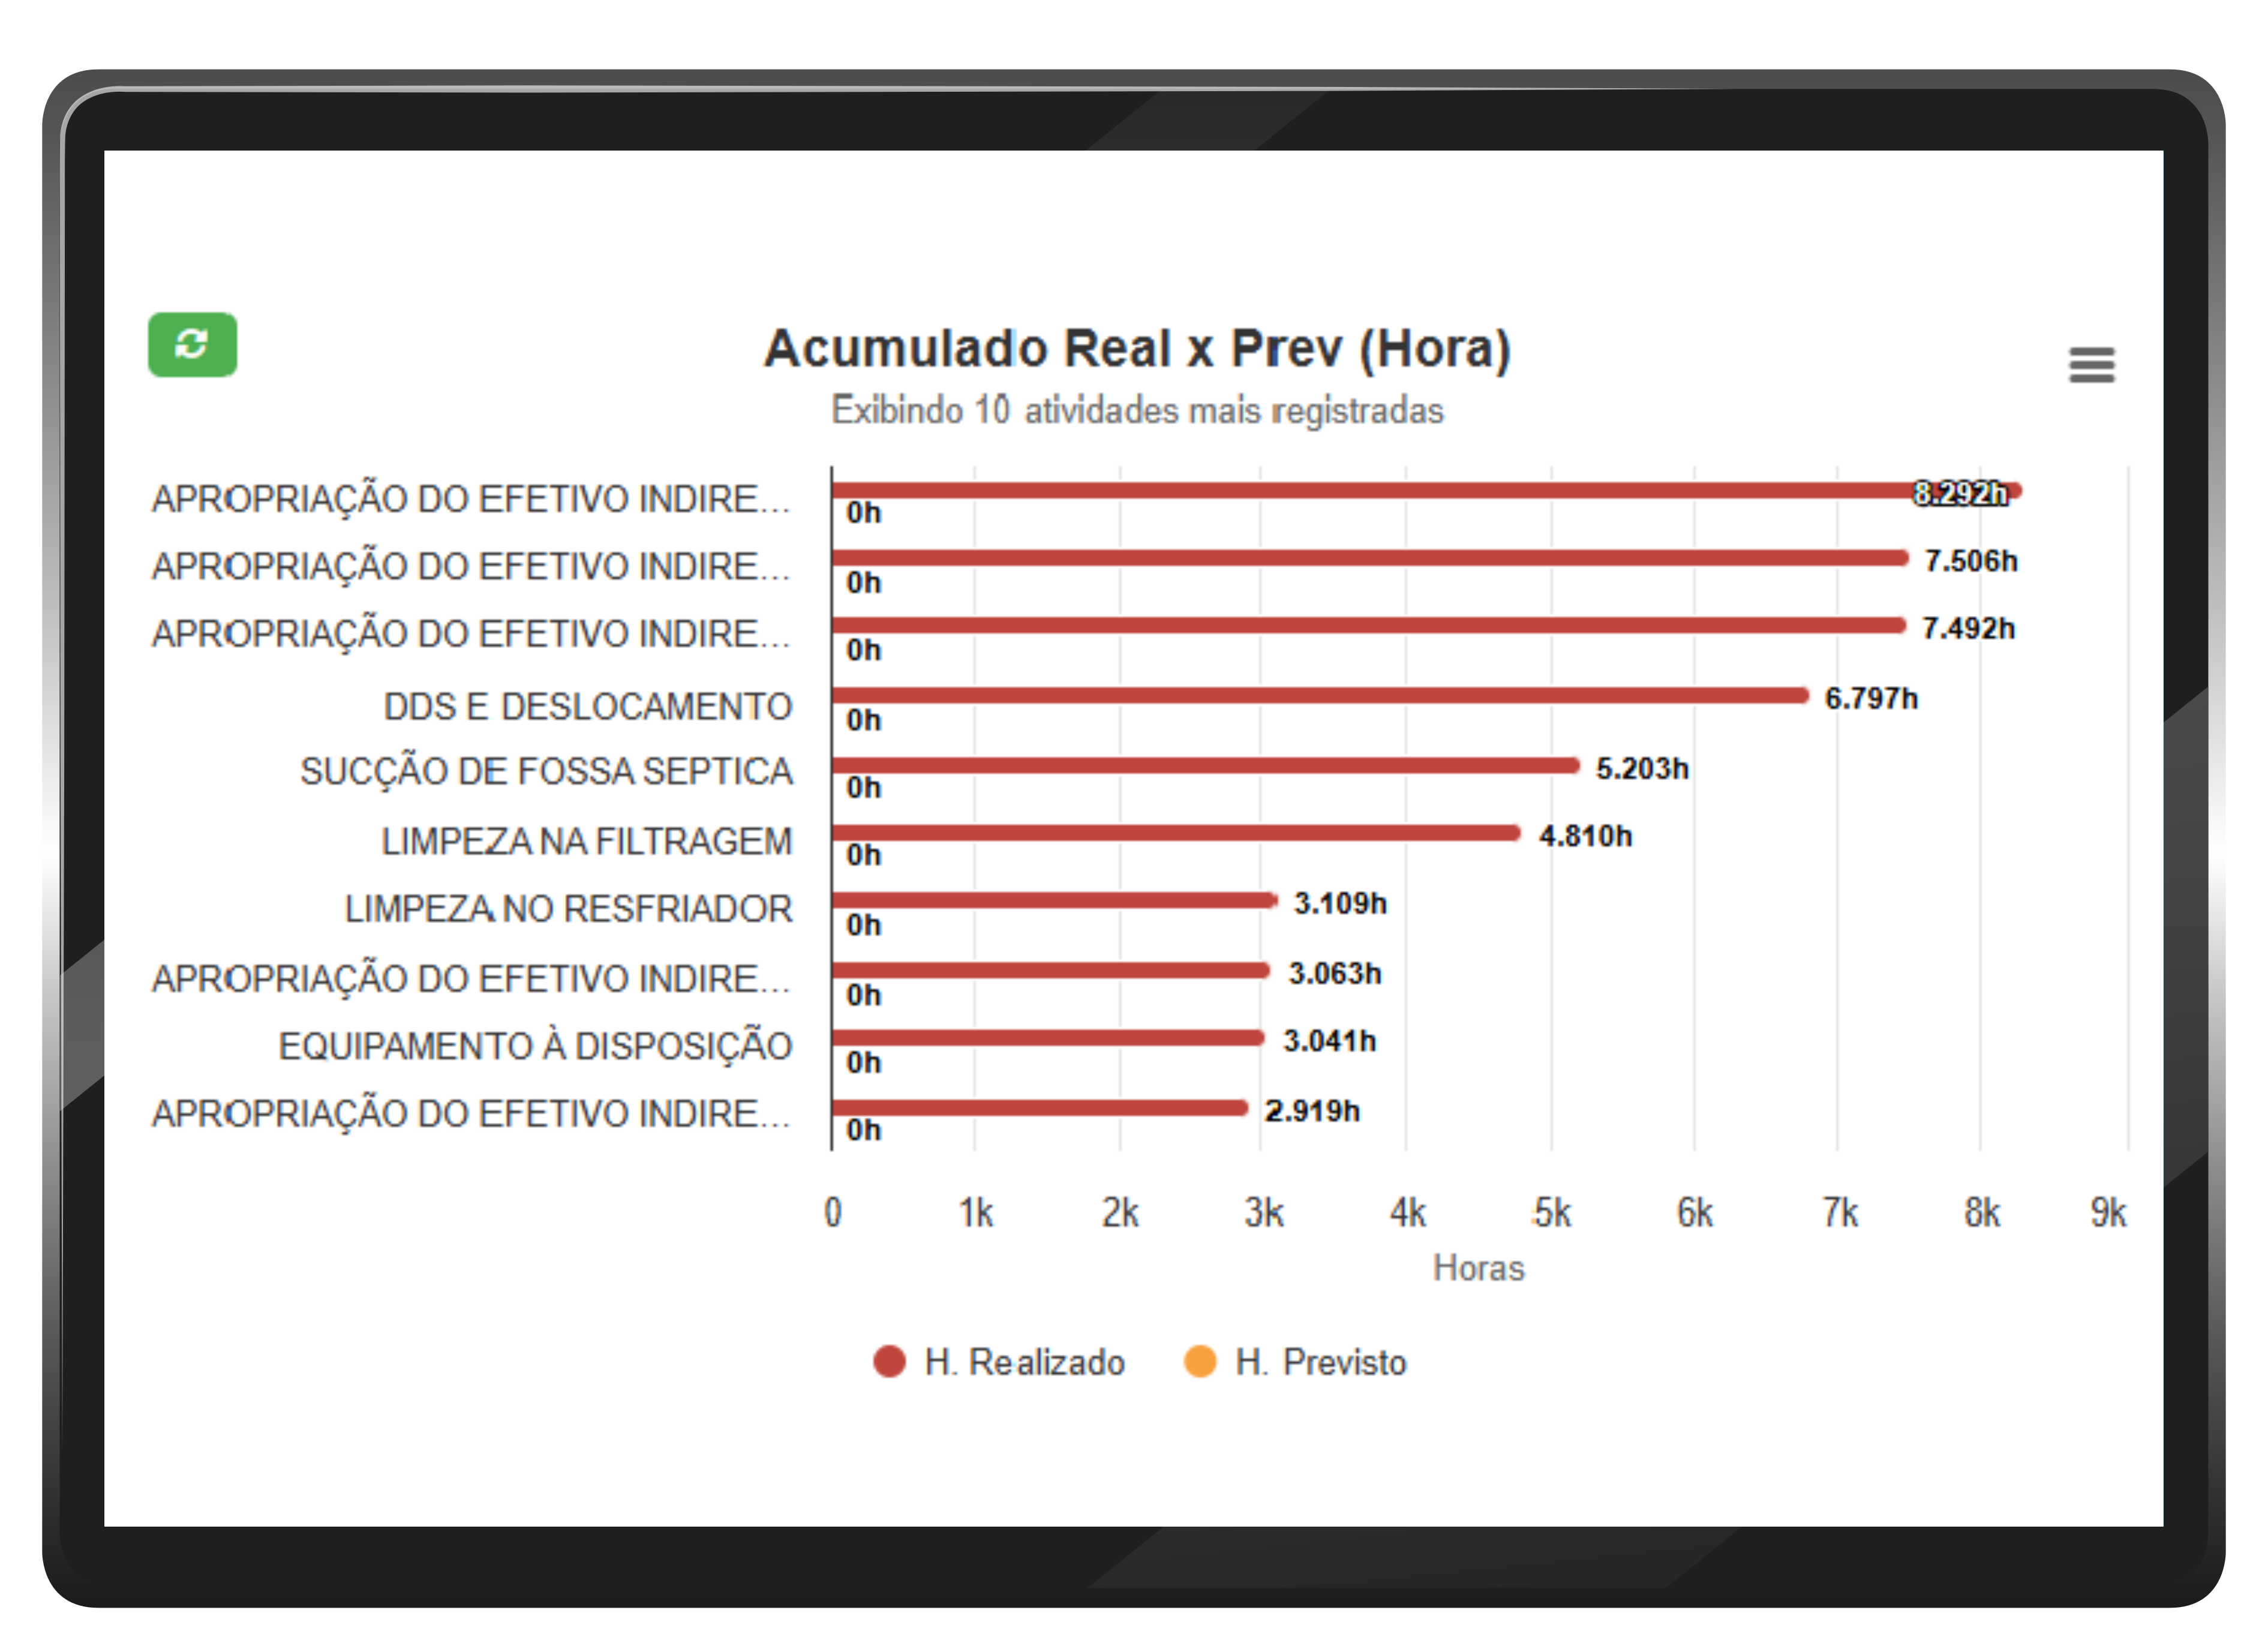
Since the platform has access to both resource consumption (workforce and equipment) and physical progress (tasks and quantities) as well as the schedule, it is capable of taking you from simple monitoring of "what was done" to the analysis of "how efficient we were".
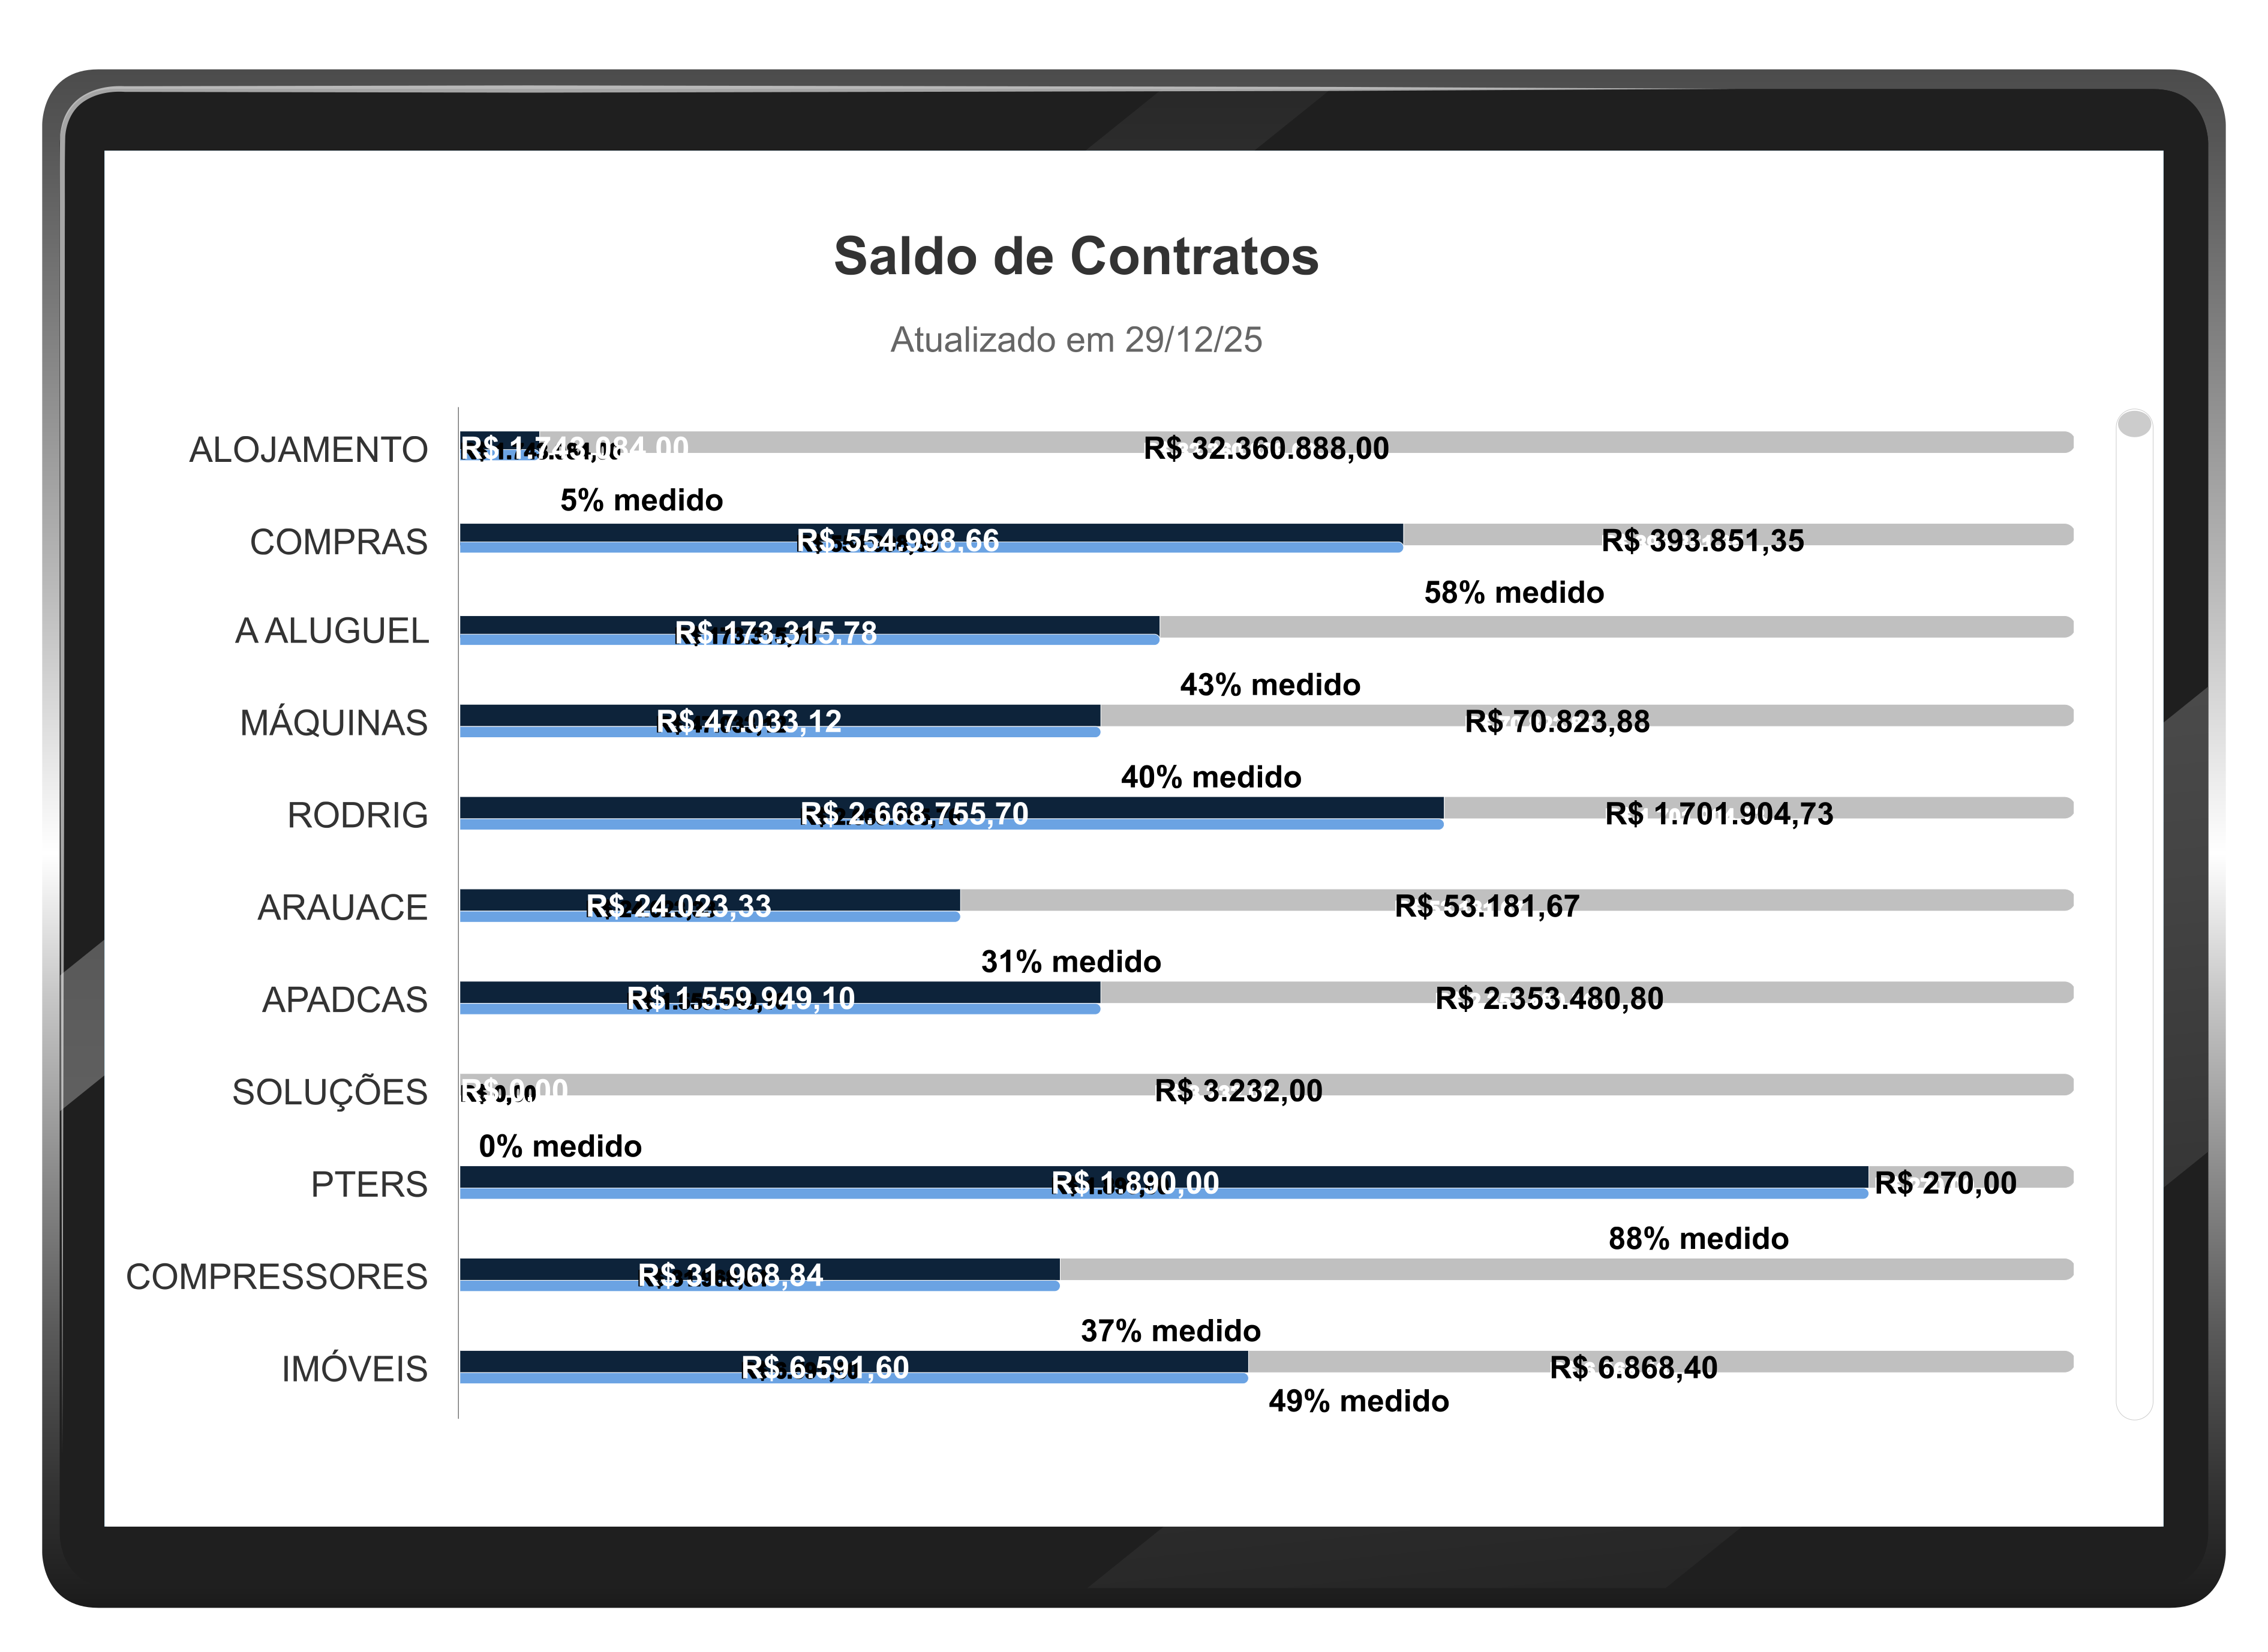
Balance and Contract Control
The Financial Module dashboard is an initial control panel that consolidates and displays the main indicators to monitor the financial health of contracts.
Its main goal is providing a centralized, real-time view of contract status. Through it, administrators can track charts, KPIs, and metrics such as financial balance, contract deadlines, issued measurements, and amendments.
Approval Workflow
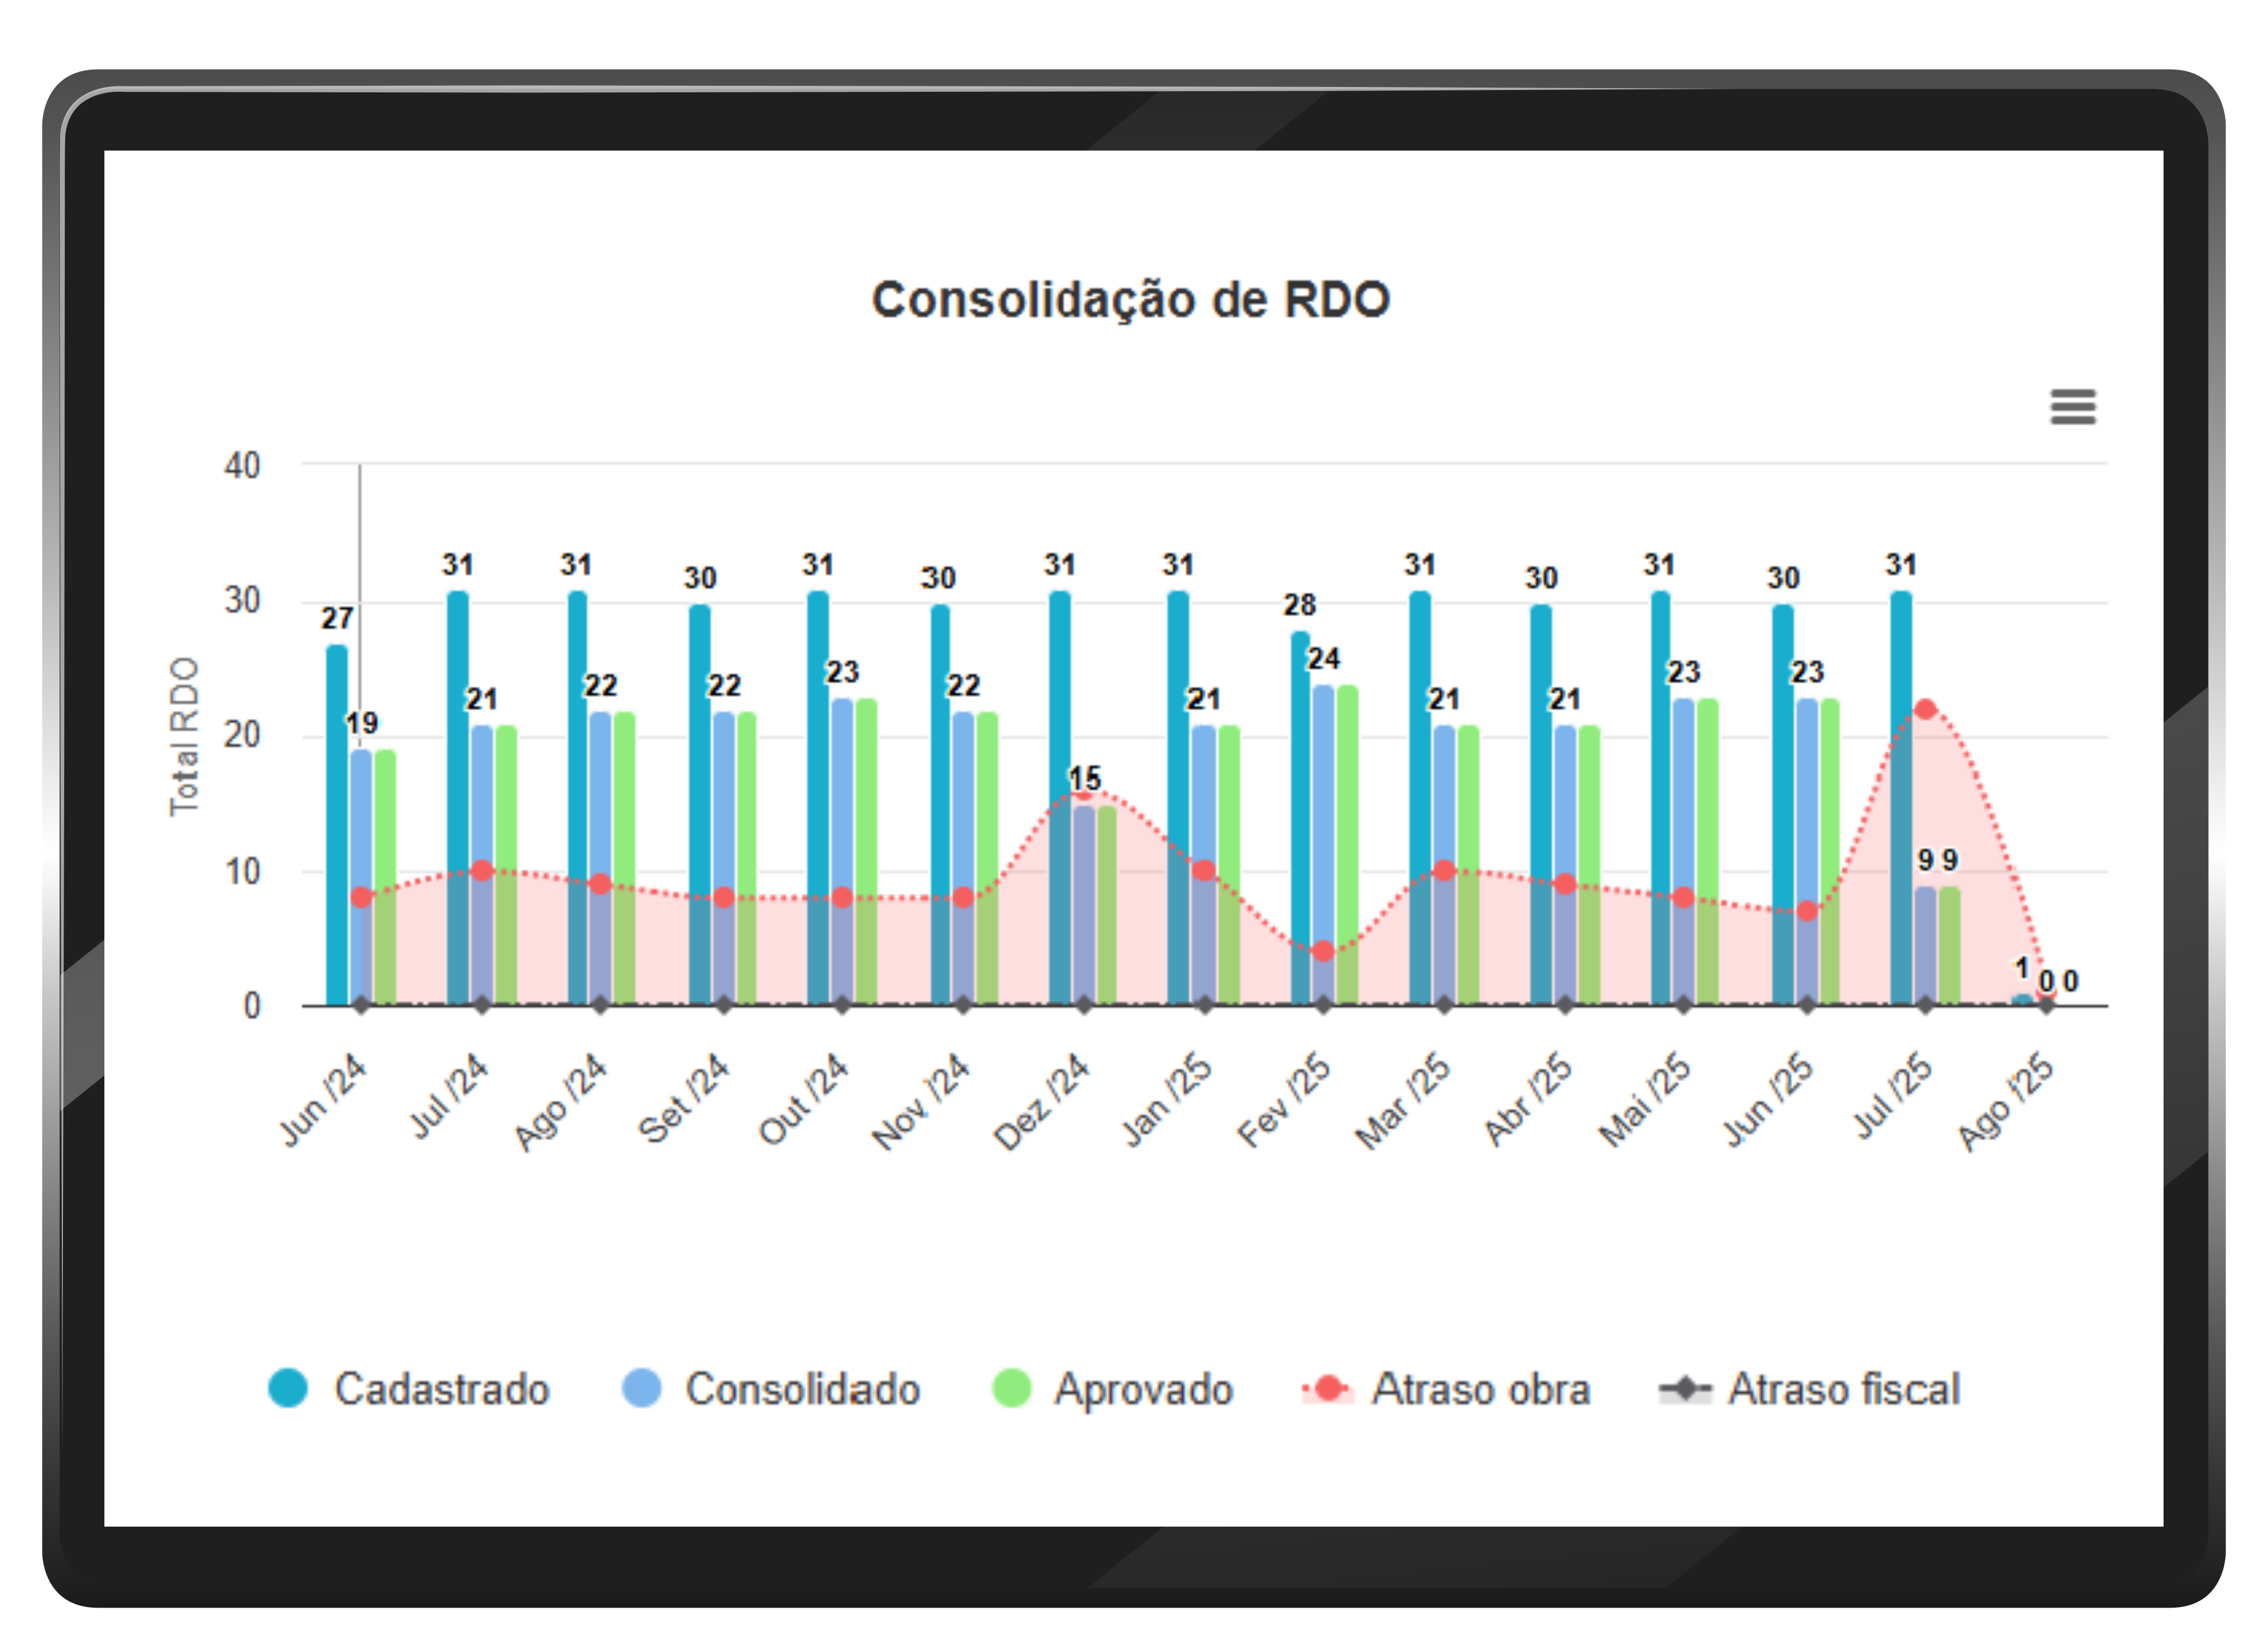
The workflow is structured into logical stages that can be adapted according to the contract or the company’s organizational structure. It begins with data entry on-site and smoothly carries the information to subsequent levels for validation and approval.
Graphical and tabular indicators as well as email notifications are automatically generated by the platform, enabling simple and fast monitoring.
Weather conditions
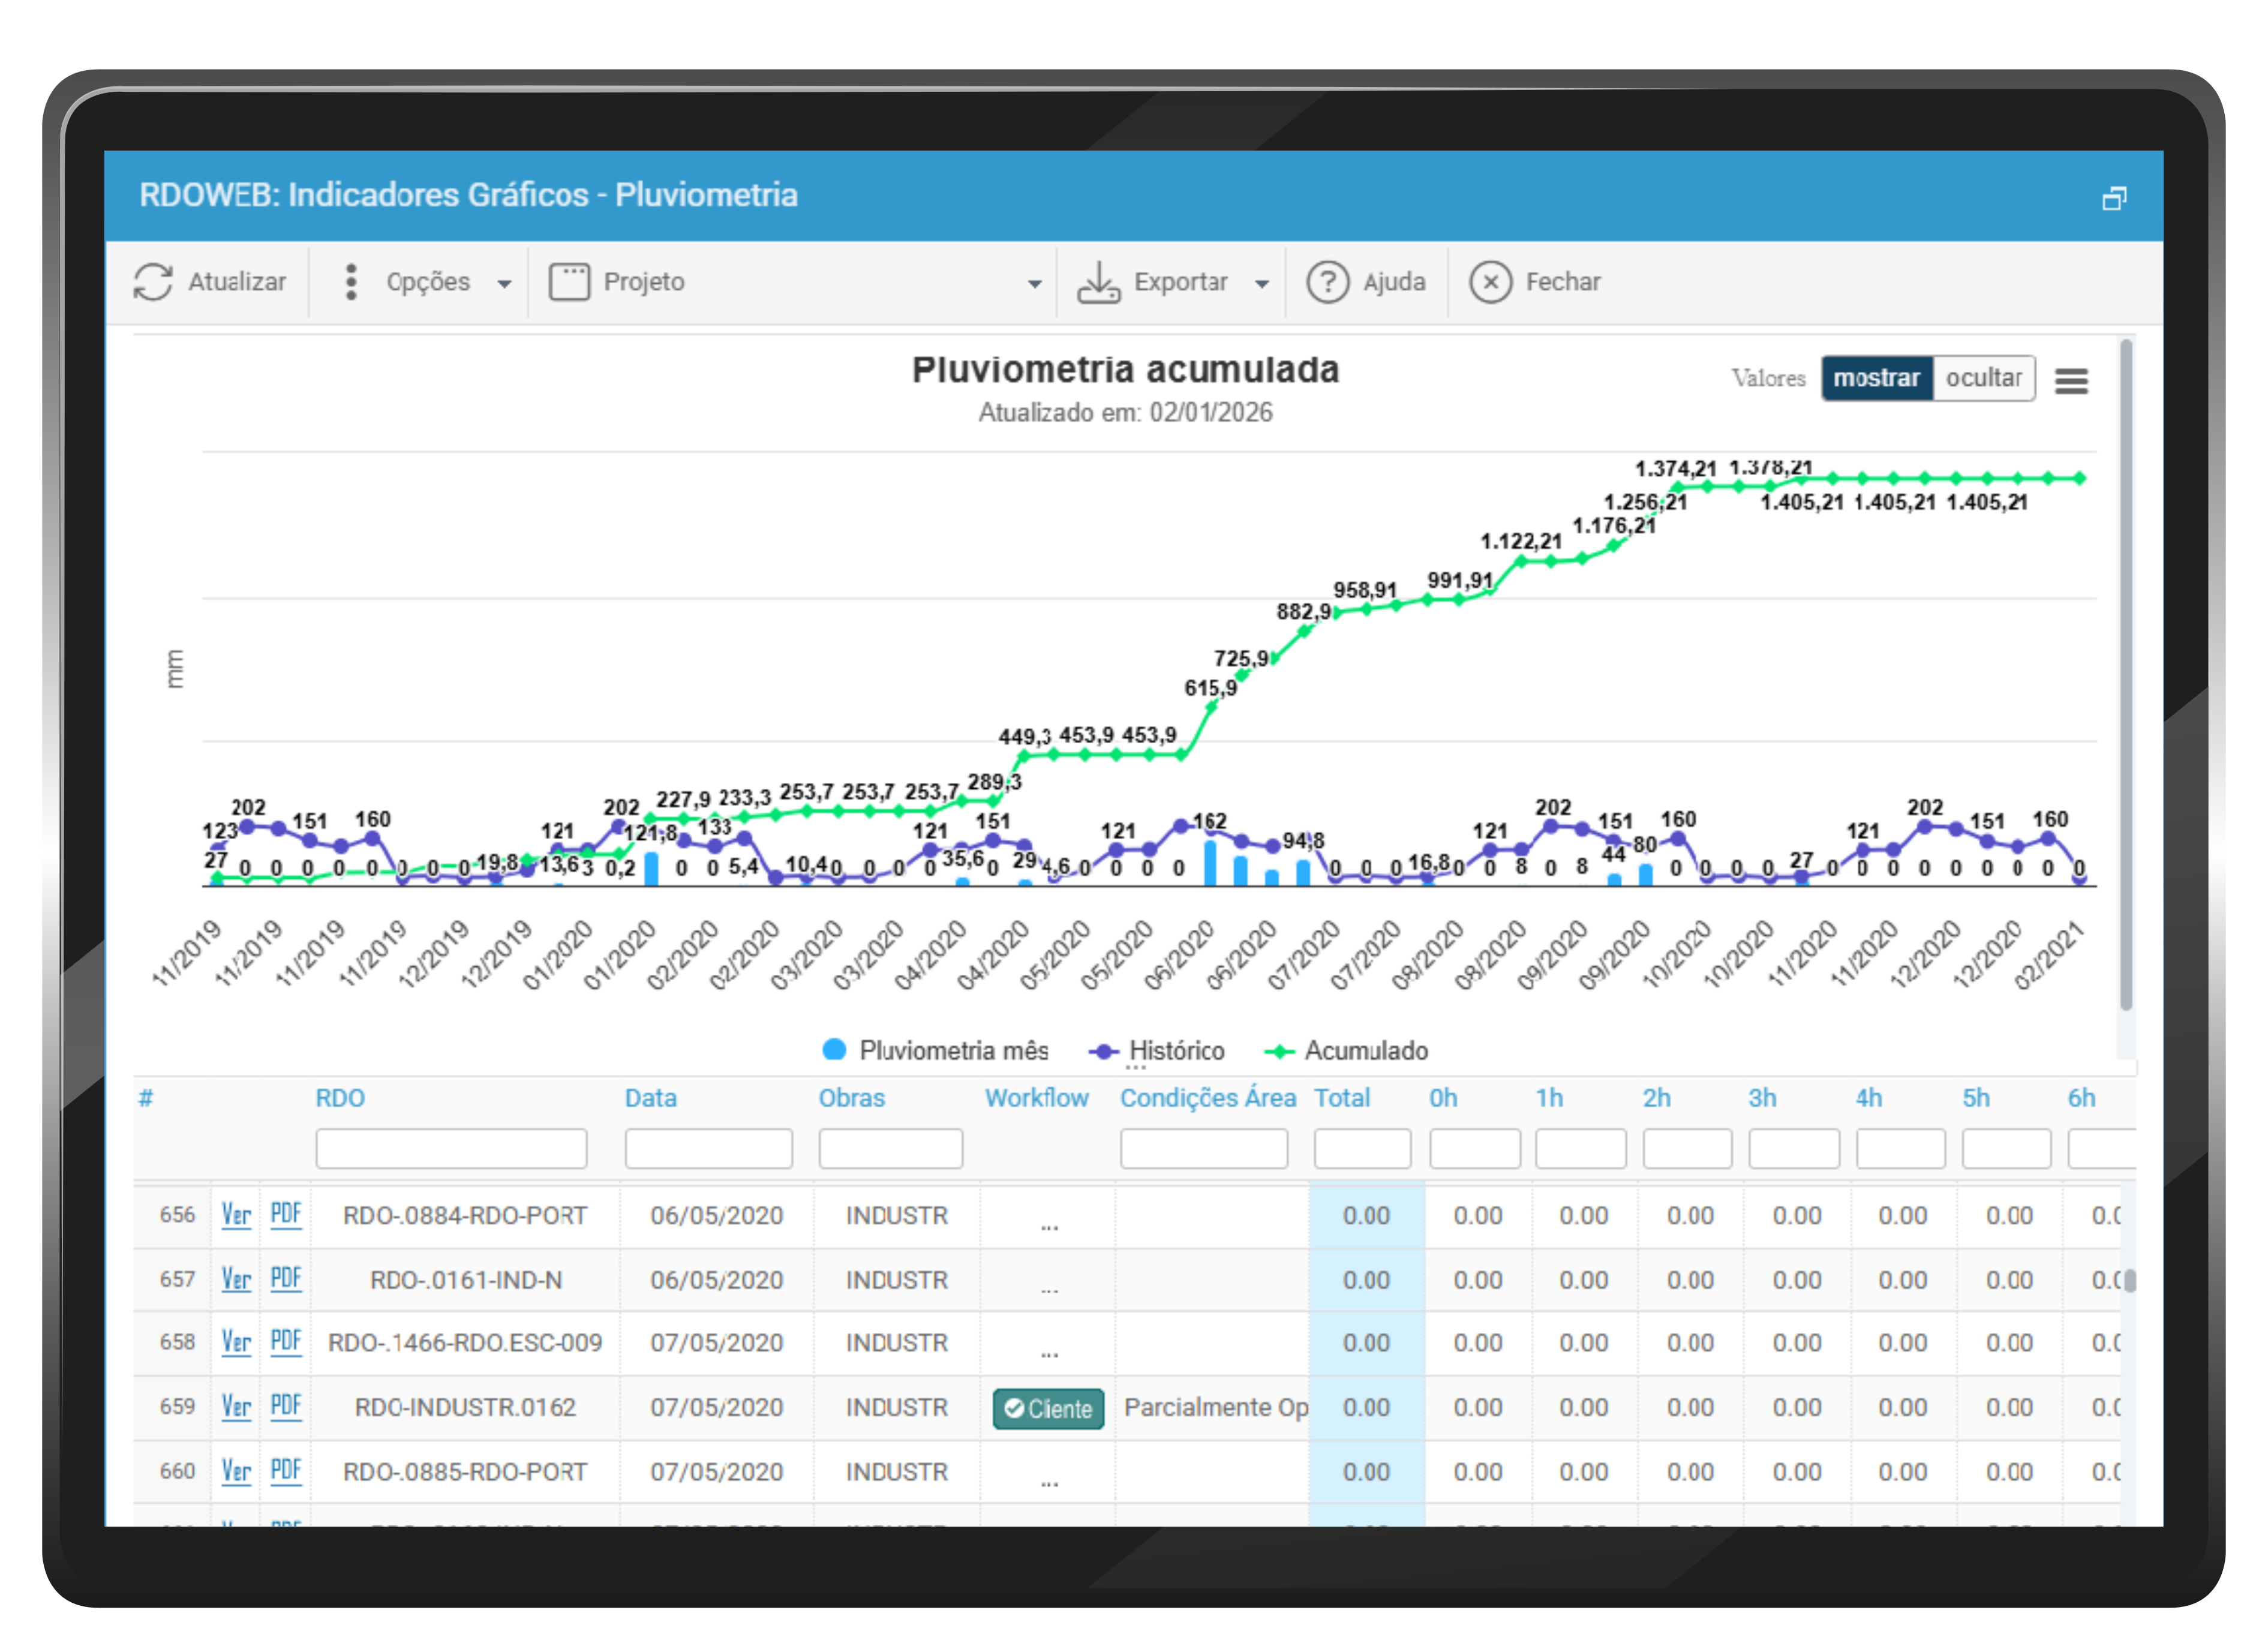
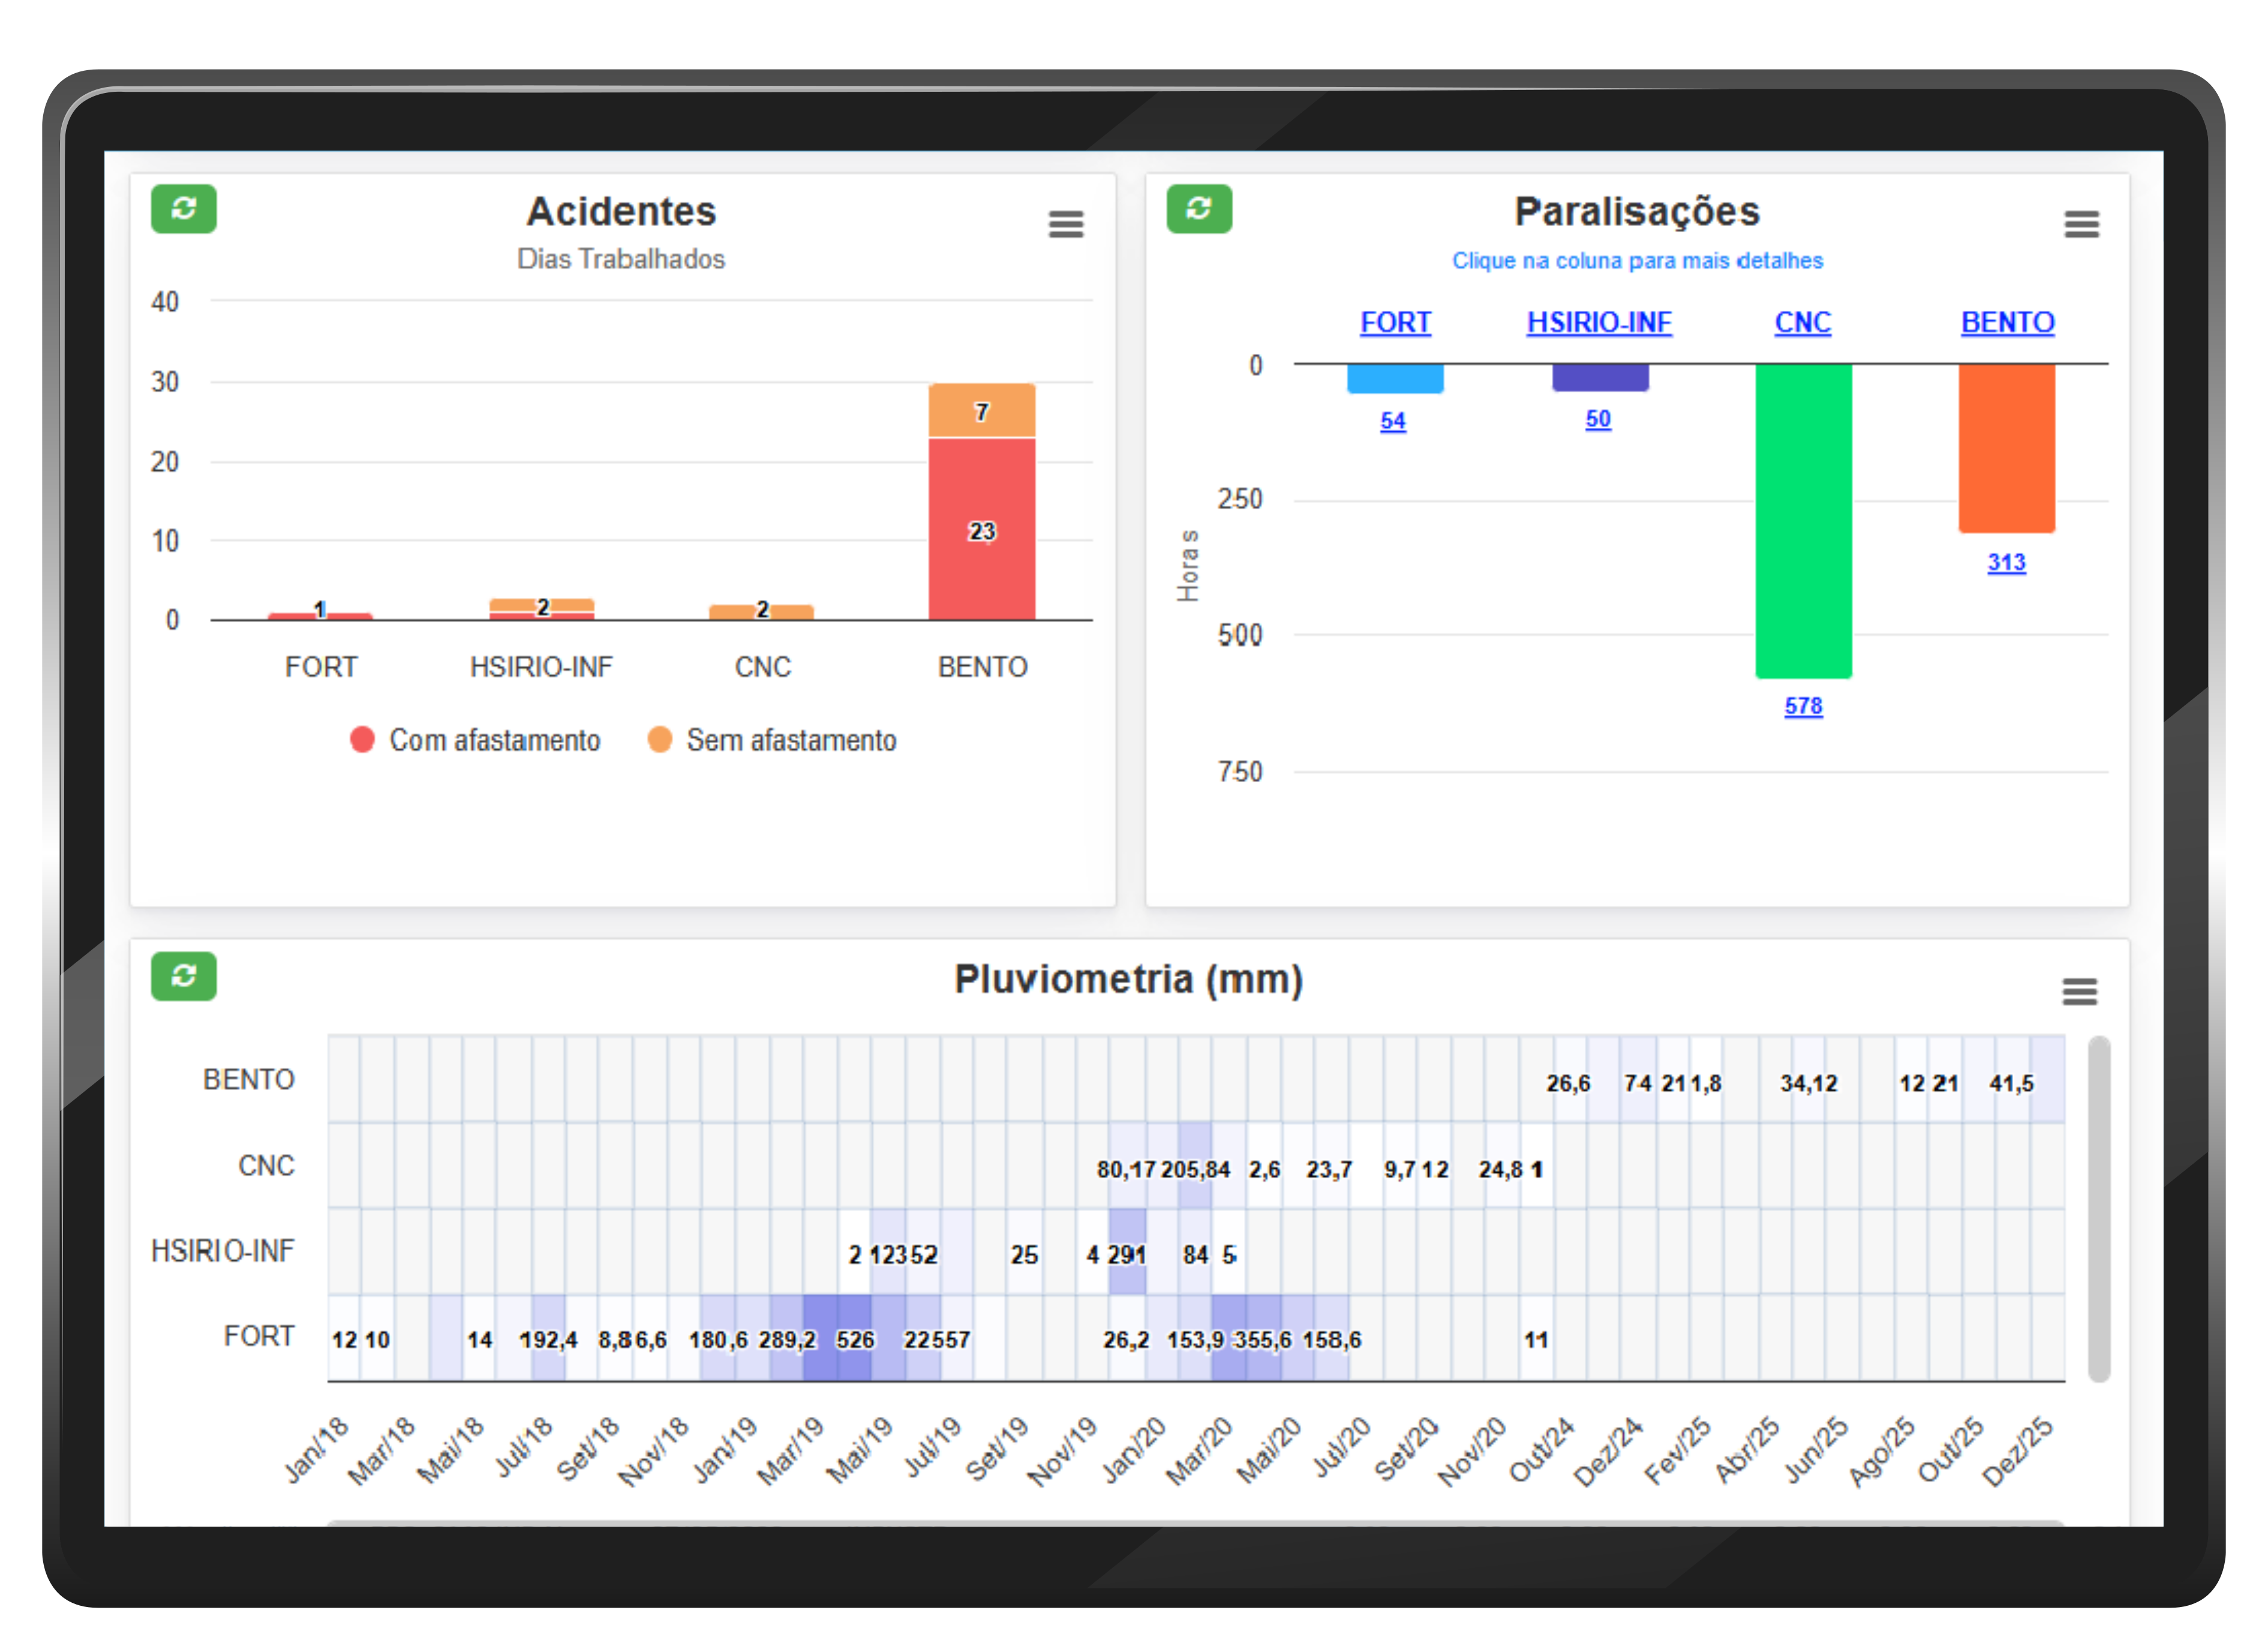
Multiple weather indicators monitor rainfall, wind, and temperature. You can also configure the contract’s historical rainfall average, and the platform cross-references real data with the historical series, enabling the identification of atypical patterns and proactive decision-making.
Downtimes & Interferences
RDOWEB records downtime and productivity interferences through CDRs. From these records, several charts are generated, such as total downtime hours and impacts on task productivity.
By keeping track of downtime, BI goes beyond indicating low productivity and begins to explain why, enabling the creation of a Pareto chart of productivity loss causes, distinguishing management failures (such as lack of materials) from external factors (such as rain or client interference).
S Curve
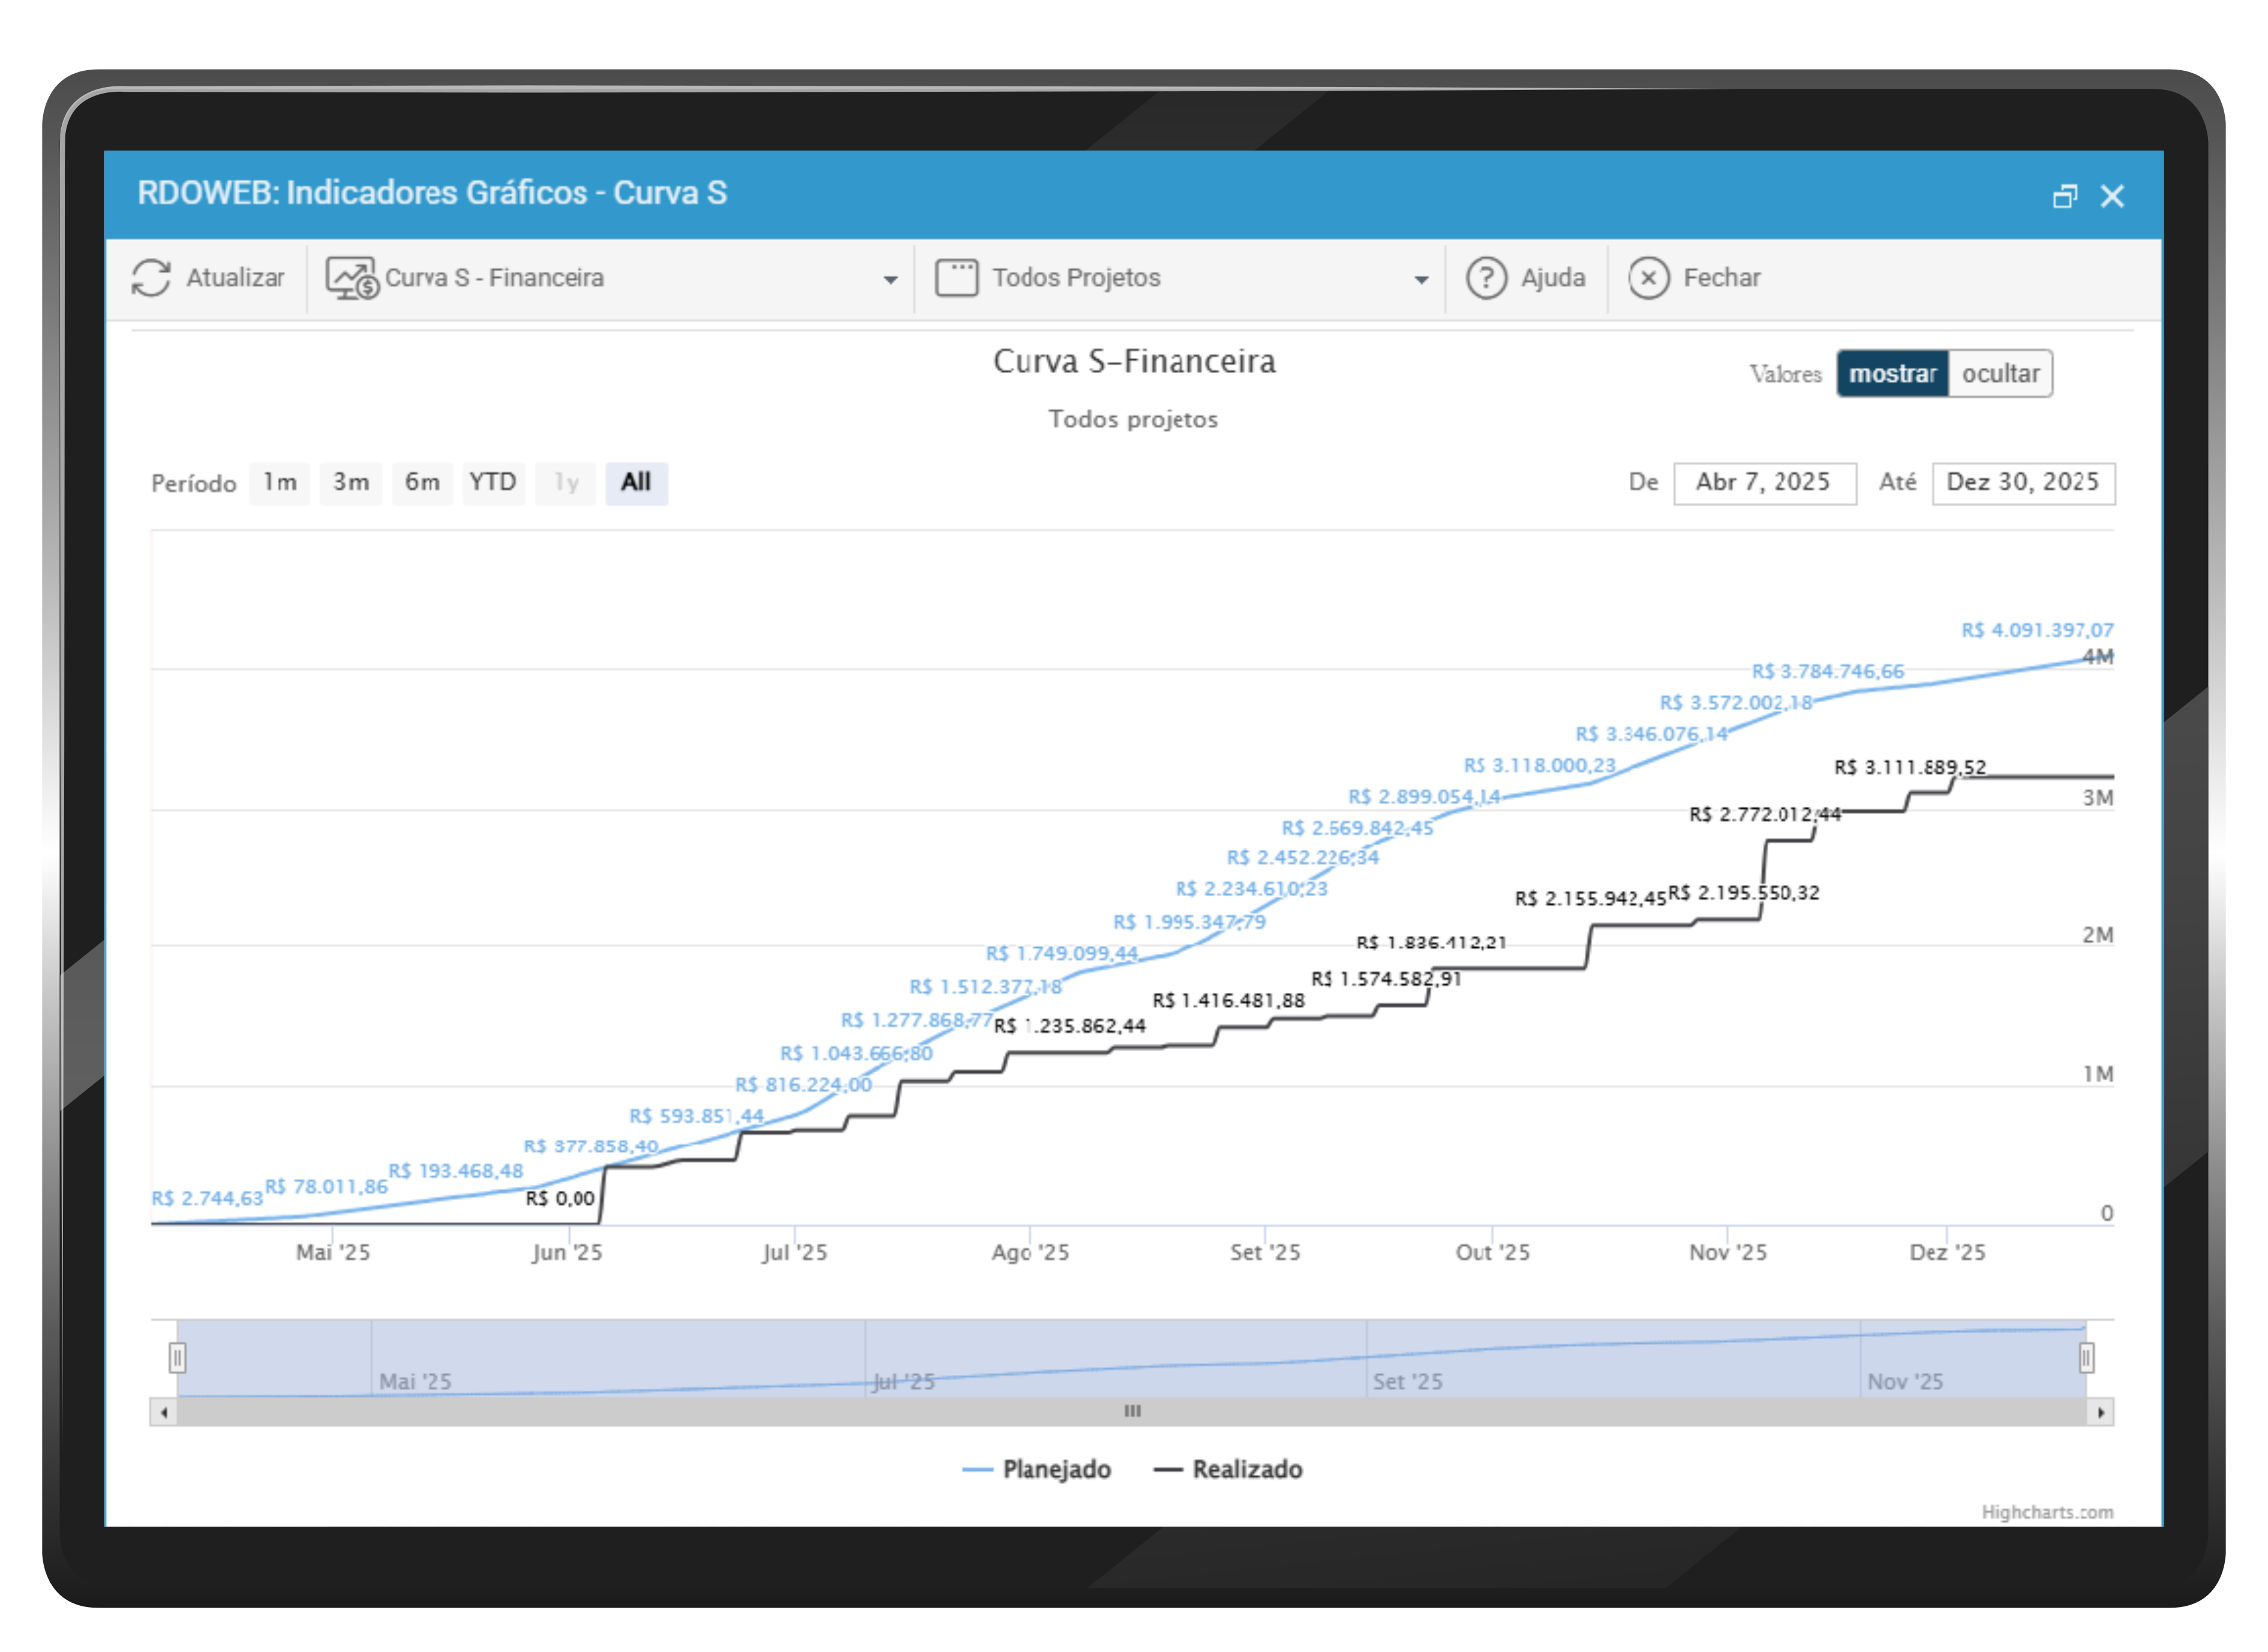
The S Curve is one of the most powerful tools for project monitoring, as it transforms complex tabular data into immediate visual insight: the curve’s slope and the distance between the lines (Planned vs. Actual) tell the story of the project’s health.
RDOWEB generates S-Curves based on what was recorded in DWRs, cross-referencing schedule data (planned tasks) with what was actually performed.
Planned vs Actual
In the context of RDOWEB, this tool becomes even more accurate because the "Actual" is not a subjective estimate, but the exact sum of quantities and physical progress validated daily through RDO.
Clients
















































































REQUEST DEMO
Fill in the form and one of our specialists will contact you to schedule a meeting the best day and time.